Solana Testing Downtrend Resistance as Bulls Push for Breakout
Solana is rebounding from $140 support and approaching key trendline resistance. Indicators suggest bullish momentum may lead to a breakout.

Crypto Laddin
Author

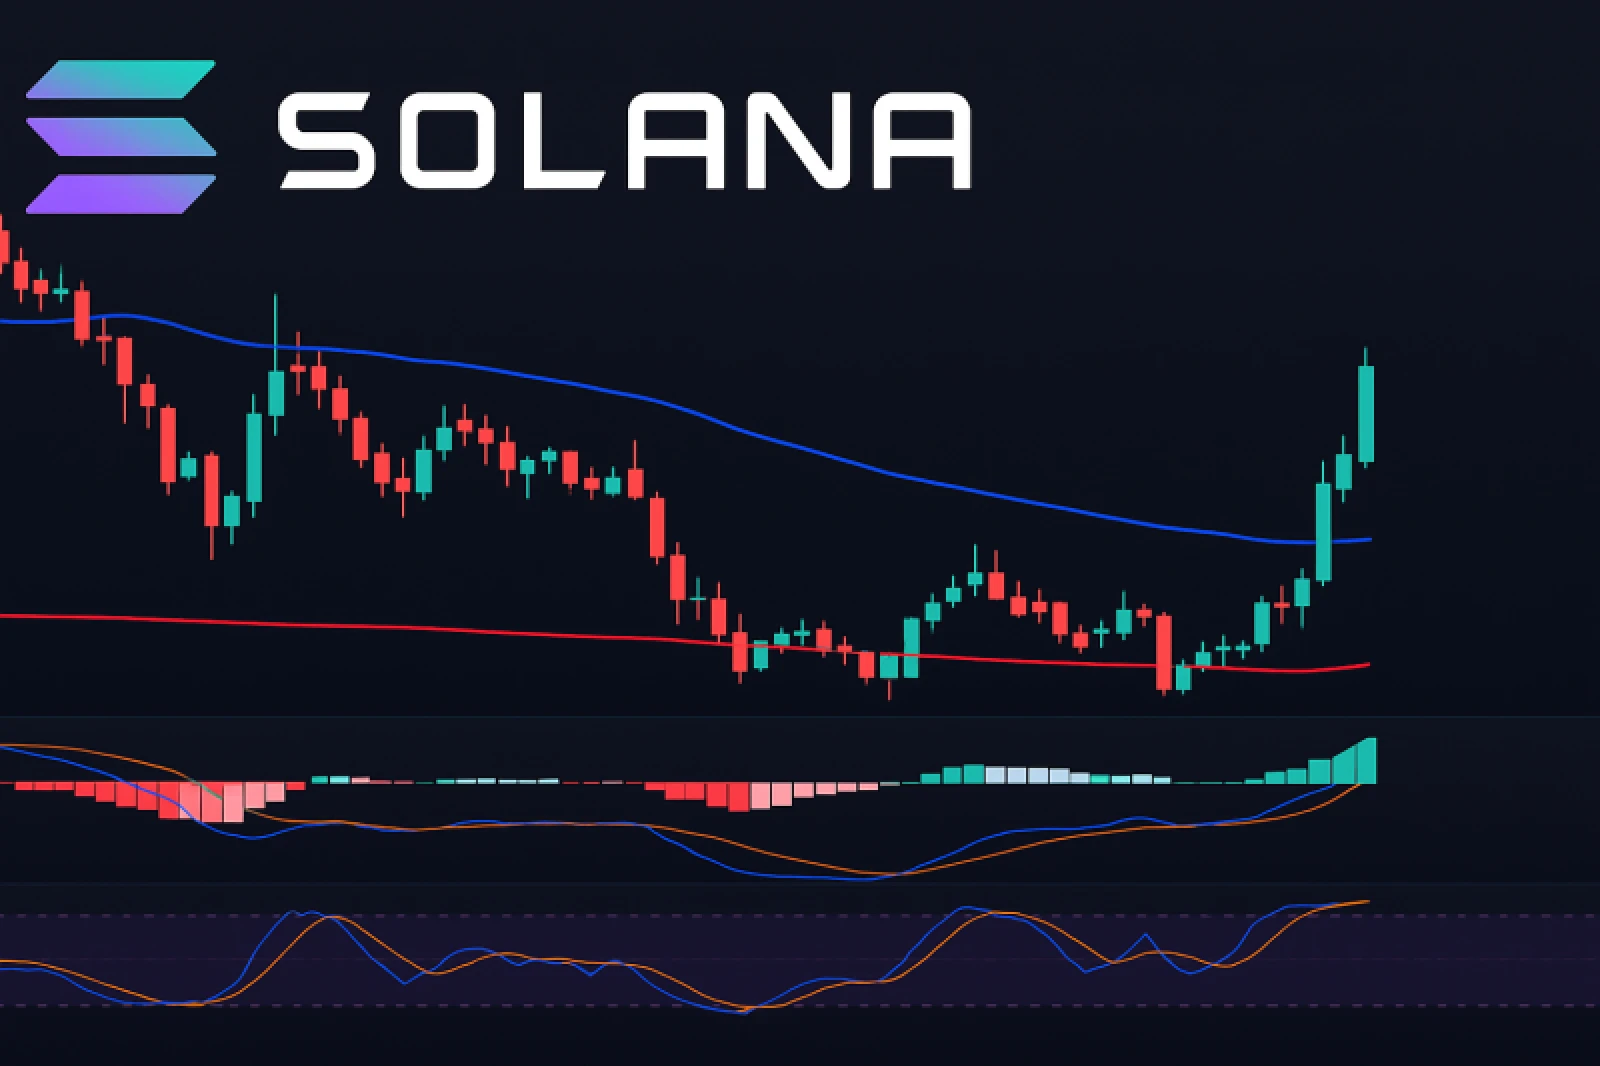
Solana (SOL) has been trading within a downward-sloping channel, but a strong bounce from the $139–$140 support zone — coinciding with the 0.764 Fibonacci retracement level at $139.60 — indicates that buyers may be regaining control.
The cryptocurrency has since reclaimed the 0.618 ($141.52) and 0.5 ($143.07) Fibonacci levels and is currently holding above the 0.382 level at $144.63. These movements hint at growing bullish momentum, especially as price nears the descending trendline resistance formed since late April.
Supporting this view is the moving average setup: the 100 SMA remains above the 200 SMA, suggesting the path of least resistance could still be upward. Meanwhile, momentum indicators such as stochastic and MACD are turning bullish — with stochastic rising from oversold levels and MACD showing signs of a bullish crossover.
If Solana breaks through the trendline resistance, the next key target lies at $149.65, followed by the psychological $152 level. However, failure to breach the trendline could lead to pullbacks toward $143.07 and $141.52, with deeper support around $139.60 and $136.49.
Traders are advised to monitor candlestick patterns at the trendline and pay attention to trading volume, which will be crucial in confirming whether this bounce turns into a breakout.


